The Diagnostic Dashboard was introduced during the summer of 2022--it provides analysis and recommendations based on live tests and active Event Log entries from both the Inventu Viewer Emulation Service as well as the FVTerm IIS Web Application.
Any time you are either curious about the health of your Inventu Viewer server or have an issue you are trying to understand, the Diagnostic Dashboard is a very important tool.
To Open the Diagnostic Dashboard
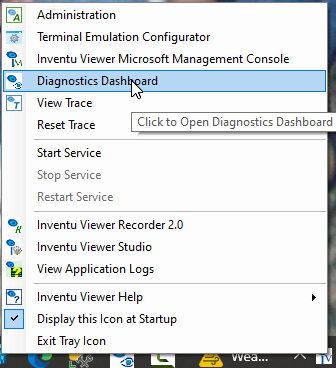
The Diagnostic Dashboard is opened from the Notification Tray Inventu Viewer Icon:

Next: Diagnostic Dashboard Startup and Actions
